Creating a line graph with multiple lines is essential for comparative analysis – tracking sales of different products, comparing website traffic sources, or plotting competing stock prices.
You can use our multiple line graph maker directly from here to visualise your comparative data quickly and easily.
In addition, this guide will show you the power of multiple line charts and how effortless it is to create them using a simple, online tool.
What Is a Multiple Line Graph and Why Is It Powerful?
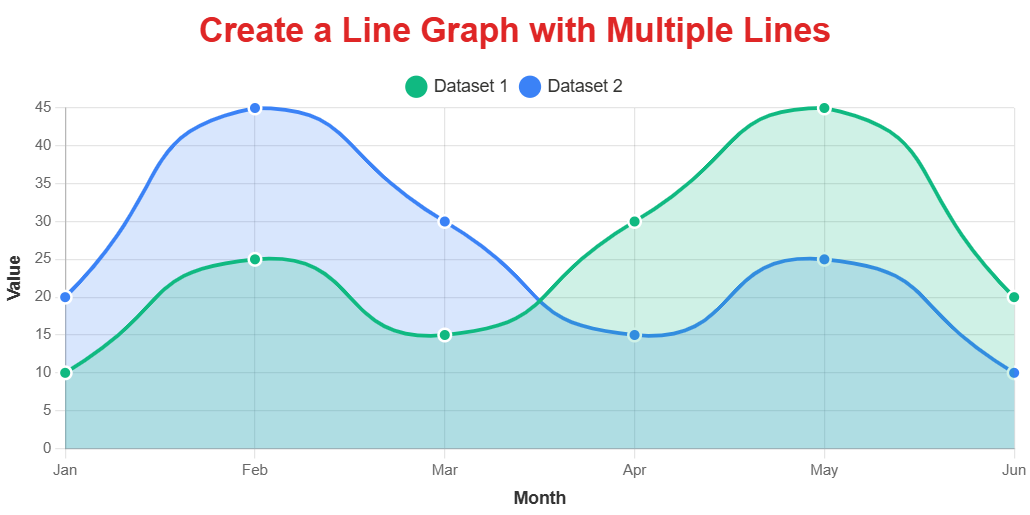
A multiple line graph is a chart that displays two or more data series on the same grid, with each line representing a separate dataset.
All lines share a common X-axis — usually time, categories, or labels — which makes it easy to compare how different variables change side by side.
Why Use a Multiple Line Graph?
Using a line graph with multiple lines offers several key advantages:
- Direct Comparison: Instantly see how multiple variables relate or differ over the same period or category.
- Identify Relationships: Spot correlations, trend intersections, or divergences between datasets.
- Comprehensive View: Gain insights from the overall data landscape instead of analyzing trends in isolation.
- Clear Communication: Present complex comparisons in a simple, visual format that’s easy for any audience to understand.
A reliable multiple line graph generator makes it easy to create and share these visual insights — without needing spreadsheets or complex software.
Here Is Your Multiple Line Graph Maker
You need a tool that simplifies the process of adding and managing multiple datasets. Our line graph maker online is designed with ease and efficiency in mind, making the creation of multiple line graphs remarkably straightforward.
Instead of wrestling with software interfaces, you can focus on your data. The tool provides a clear path to add as many datasets as you need, all on the same chart, instantly.
This is what makes it an ideal multiple-line graph maker for anyone valuing simplicity and speed in visualizing comparative data.
Step-by-Step: Creating Your Line Graph with Multiple Lines
Creating a line graph with multiple lines using our tool is incredibly simple.
Follow these steps to visualize your comparative data in moments:
- Visit the Tool: Go to our free online line graph generator here.
- Enter Initial Data: Start by entering the labels for your X-axis (like months, years, or categories) and the values for your first dataset.
- Add More Datasets: This is the key step for creating your line graph with multiple lines. Look for the clearly labeled “Add Dataset” button. Click this to add input fields for a second line. You can repeat this process for every additional dataset you want to include in your graph.

- Input Data for Each Line: Enter the corresponding values for each new dataset you added. Ensure the labels align correctly across all datasets for accurate plotting.
- Generate Your Graph: Once all your data is entered, click the “Generate Graph” button. Your dynamic line graph with multiple lines will appear instantly, showing all your datasets plotted together.
- Customize (Optional): Refine the appearance of your graph for better clarity or style. You can easily change the color and style (solid, dashed, dotted) for each line to enhance readability and visual appeal. Adjust axis ranges, fonts, and grid lines as needed.
- Download: Happy with your multiple line graph? Click “Download Graph” to save it as a crisp, high-quality PNG file.

That’s all there is to it! You’ve created a professional line graph with multiple lines effortlessly online.
The Effortless Advantage
The ease of adding multiple datasets is a core strength of our tool, setting it apart as an efficient multiple line graph maker.
You don’t need to format complex spreadsheets or navigate confusing menus. The interface is intuitive, allowing you to focus on the data itself and the insights it reveals.
This makes it a truly effortless multiple line graph maker.
Whether you’re a student, a professional, or anyone needing quick comparative visuals, our line graph maker with multiple lines provides a seamless online solution.
Ready to Create Multi-Line Graphs Effortlessly?
Our free online tool is the multiple line graph maker you need to visualise comparative data quickly and easily.
Adding multiple datasets is a breeze, and you get professional, customizable results every time.
Create multiple line graphs now effortlessly with our online tool!
Experience how easy it is to create a line graph with multiple lines today.