Visualising data quickly and effectively is essential. Whether you’re analysing sales trends, tracking project progress, or presenting research findings, a line graph is a powerful tool for showing how data changes over time or across categories.
But who has time for complicated software or manual drawing? If you need to generate line graphs online free and fast, you’ve come to the right place.
This guide will show you how using an online line graph generator can be the quickest and most efficient way to turn your raw data into clear, professional visuals.
Why Speed Matters When Creating Graphs
When deadlines are looming or you need to make a quick decision based on data, waiting around for software to load or struggling with complex interfaces isn’t an option.
A fast line graph maker allows you to:
- React Quickly: Spot trends and patterns instantly to inform immediate actions.
- Save Time: Eliminate tedious manual steps, freeing you up for deeper analysis.
- Stay Agile: Easily update and regenerate graphs as new data becomes available.
- Communicate Faster: Share visual insights with colleagues, clients, or stakeholders without delay.
Traditional methods or cumbersome software can slow you down. That’s where a dedicated, easy-to-use online line graph generator shines.
Introducing the Fastest Free Online Line Graph Generator
You need a tool that’s not only free but also incredibly simple and fast. Our free line graph generator online is designed with speed and efficiency in mind.
You can generate a line graph free in seconds, without needing to download anything or even create an account. Just simple data visualisation, delivered quickly.
You can get started instantly by using our online line graph generator.
How does it make generating graphs so fast?
- No Signup, No Fees: Unlike many tools, there’s no barrier to entry. Open the page and start working immediately. This cuts out registration time and potential payment hurdles.
- Intuitive Interface: The design is clean and straightforward. You won’t spend time searching for buttons or trying to understand complex menus.
- Simple Data Input: Easily enter your data points directly or use the convenient CSV upload feature for larger datasets. [Visual Suggestion 1: Screenshot showing the data input fields (Labels, Values) and the “Upload CSV” option.]
- Instant Generation: As soon as your data is entered and settings are chosen, click “Generate Graph” and watch your visualization appear instantly.
This focus on simplicity and direct functionality makes it the fastest way to generate a line graph online for free.
How to Generate Your Line Graph Quickly
Using our fast line graph tool is designed to be as fast as possible. Here’s a quick rundown of the simple steps:
- Enter Graph Details: Give your graph a title and label your X and Y axes.
- Add Your Data: Input your labels (like time periods or categories) and the corresponding values for each dataset. For multiple lines, simply add another dataset.
- Customise (Optional, but Quick!): Want to change colours or line styles? The customisation options are readily available and easy to adjust without slowing the process.
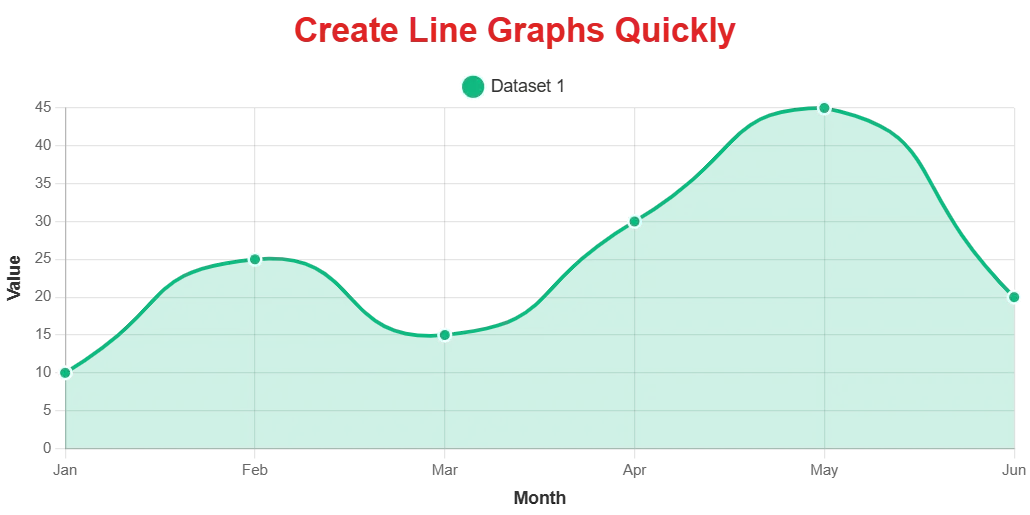
- Generate and Download: Click “Generate Graph” to see your chart. If it looks good, hit “Download Graph” to save it as a high-quality PNG image, ready to use anywhere.
That’s it! Your professional line graph is ready in just a few moments.
Beyond Speed: Professional Results Without the Hassle
While speed is a major advantage, a great online line graph generator also delivers quality.
Our tool helps you create beautiful, clean, and professional-looking line charts suitable for any purpose.
You can easily:
- Plot Multiple Datasets to compare different data series side-by-side on the same graph.
- Tailor the appearance with Advanced Customisation Options, including colors, solid, dashed, or dotted line styles, point shapes, axis ranges, fonts, and grid lines. [Visual Suggestion 3: Screenshot showcasing the “Advanced Customisation Options” panel or a selection of customization choices like line styles or colors.]
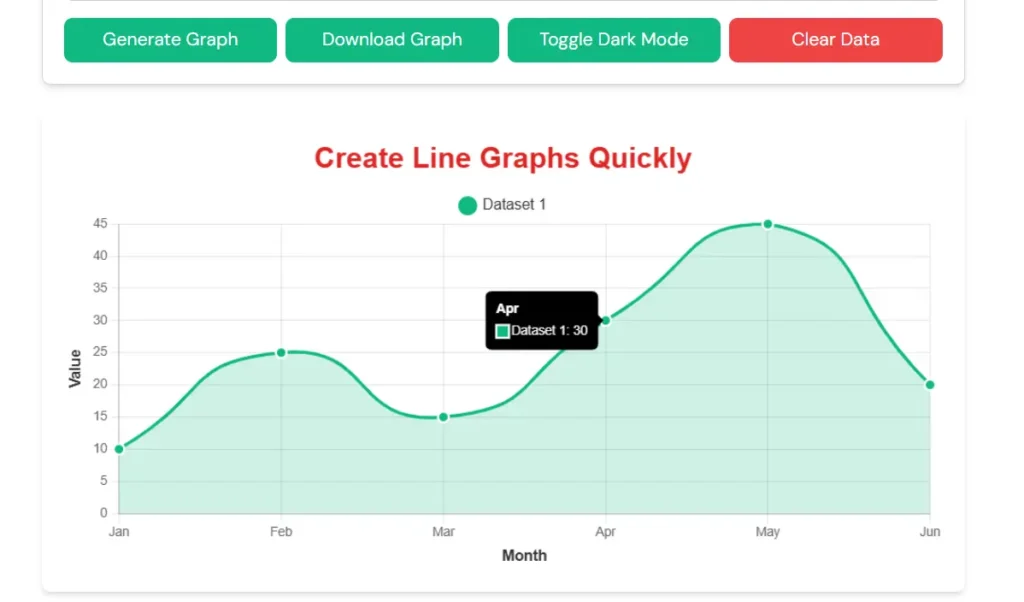
- Add Interactive Annotations to highlight specific data points or explain key trends.
- Download your chart as a High-Quality PNG file (fixed size 1030x515px) for crisp visuals in reports, presentations, or on the web.
It’s about getting professional results fast and free. You can find this easy-to-use line graph generator on our website.
Ready to Visualize Your Data Instantly?
Stop wasting time with slow, complicated software. Our free line graph generator online offers the fastest, simplest way to create clear and professional line charts.
Whether you need to visualize a single trend or compare multiple datasets, you can do it quickly and easily.
Try the fastest online generator now and create your first line graph in seconds!