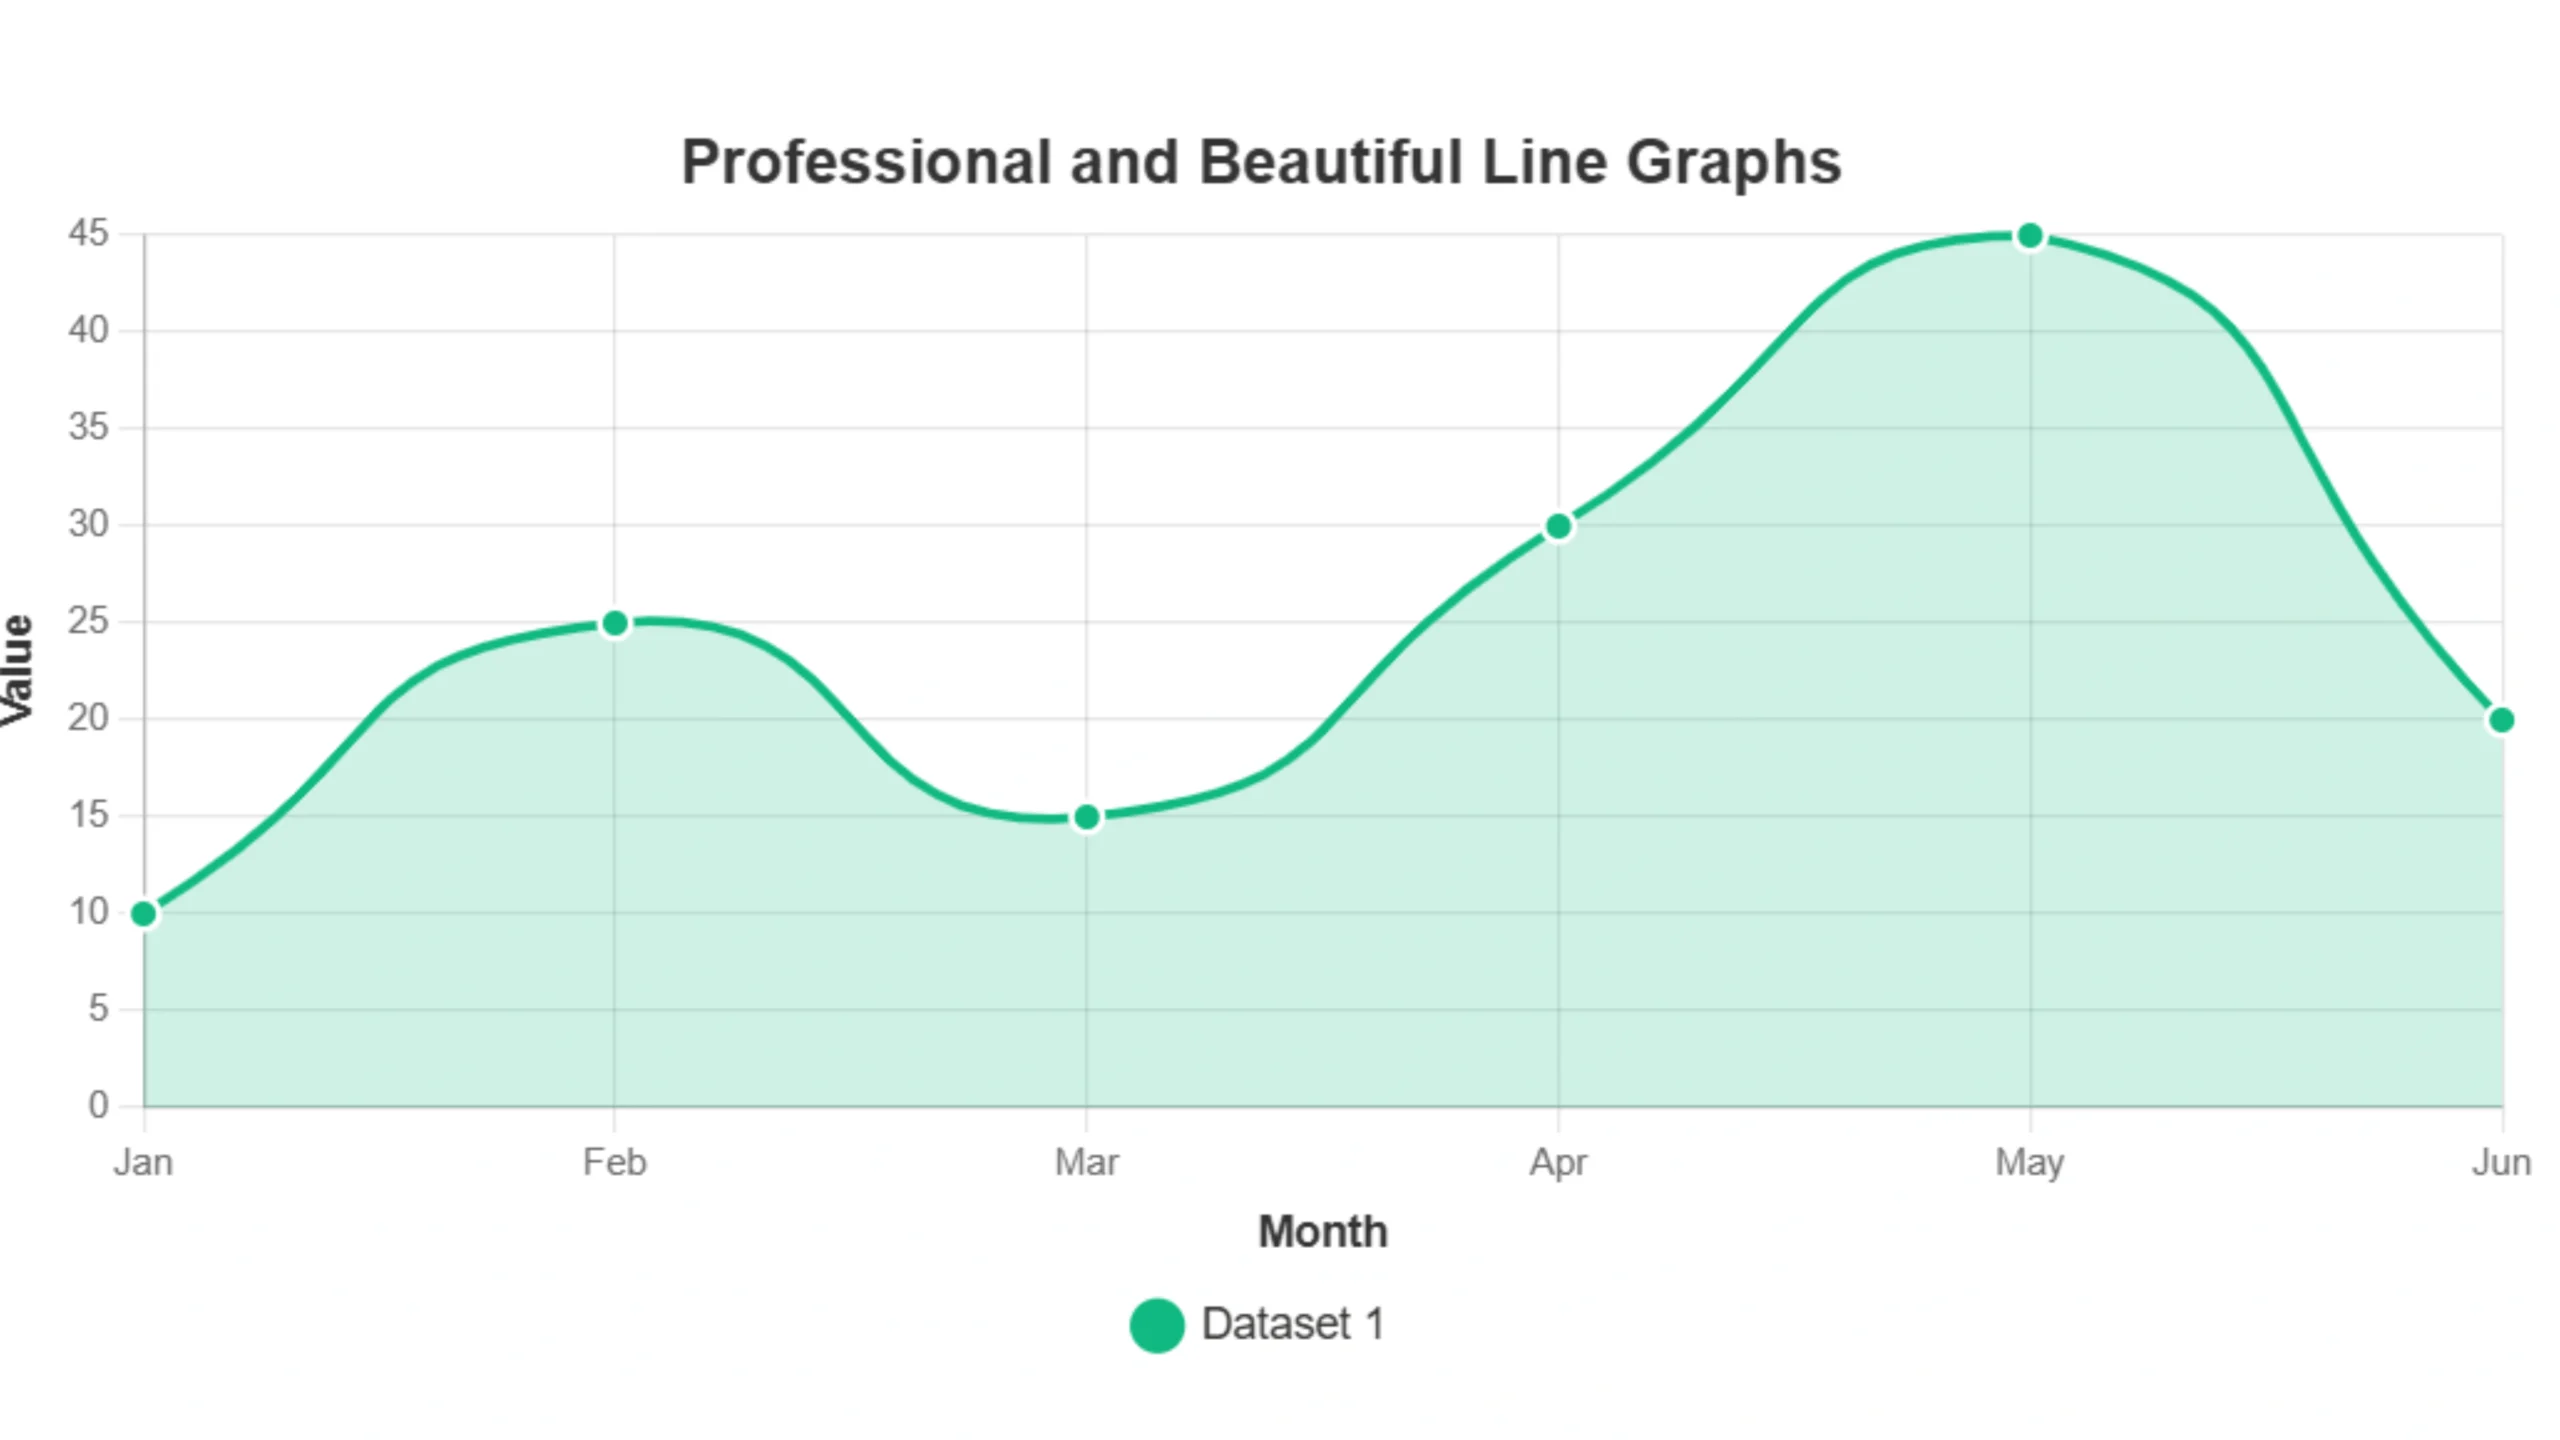
Key Components of a Line Graph for Effective Data Visualization

Line graphs are a powerful tool for visualizing data trends over time. They connect individual data points with lines, making it easier to see patterns and changes at a glance. Understanding the components of a line graph is essential for creating effective visualizations that communicate information clearly and accurately. In this article, we’ll break down … Read more

Free Line Graph Maker: Create Any Chart Type You Need Without Limits

Struggling to find a tool that lets you create professional line graphs without hitting paywalls or feature restrictions? Many “free” tools disappoint by limiting functionality or requiring subscriptions for basic features.  But what if you could access a powerful free line graph maker that genuinely lets you create any type of line chart you need, … Read more

Create Line Graph with Multiple Lines Online Free

Create a Line Graph with Multiple Lines

Creating a line graph with multiple lines is essential for comparative analysis – tracking sales of different products, comparing website traffic sources, or plotting competing stock prices.  You can use our multiple line graph maker directly from here to visualise your comparative data quickly and easily. In addition, this guide will show you the power … Read more

Generate Line Graphs Online Free: The Fastest Way to Visualize Your Data

Generate Line Graphs Online Free

Visualising data quickly and effectively is essential. Whether you’re analysing sales trends, tracking project progress, or presenting research findings, a line graph is a powerful tool for showing how data changes over time or across categories.  But who has time for complicated software or manual drawing? If you need to generate line graphs online free … Read more